Dashboard
The landing screen: everything you need to see at a glance whether the device is healthy and reading.
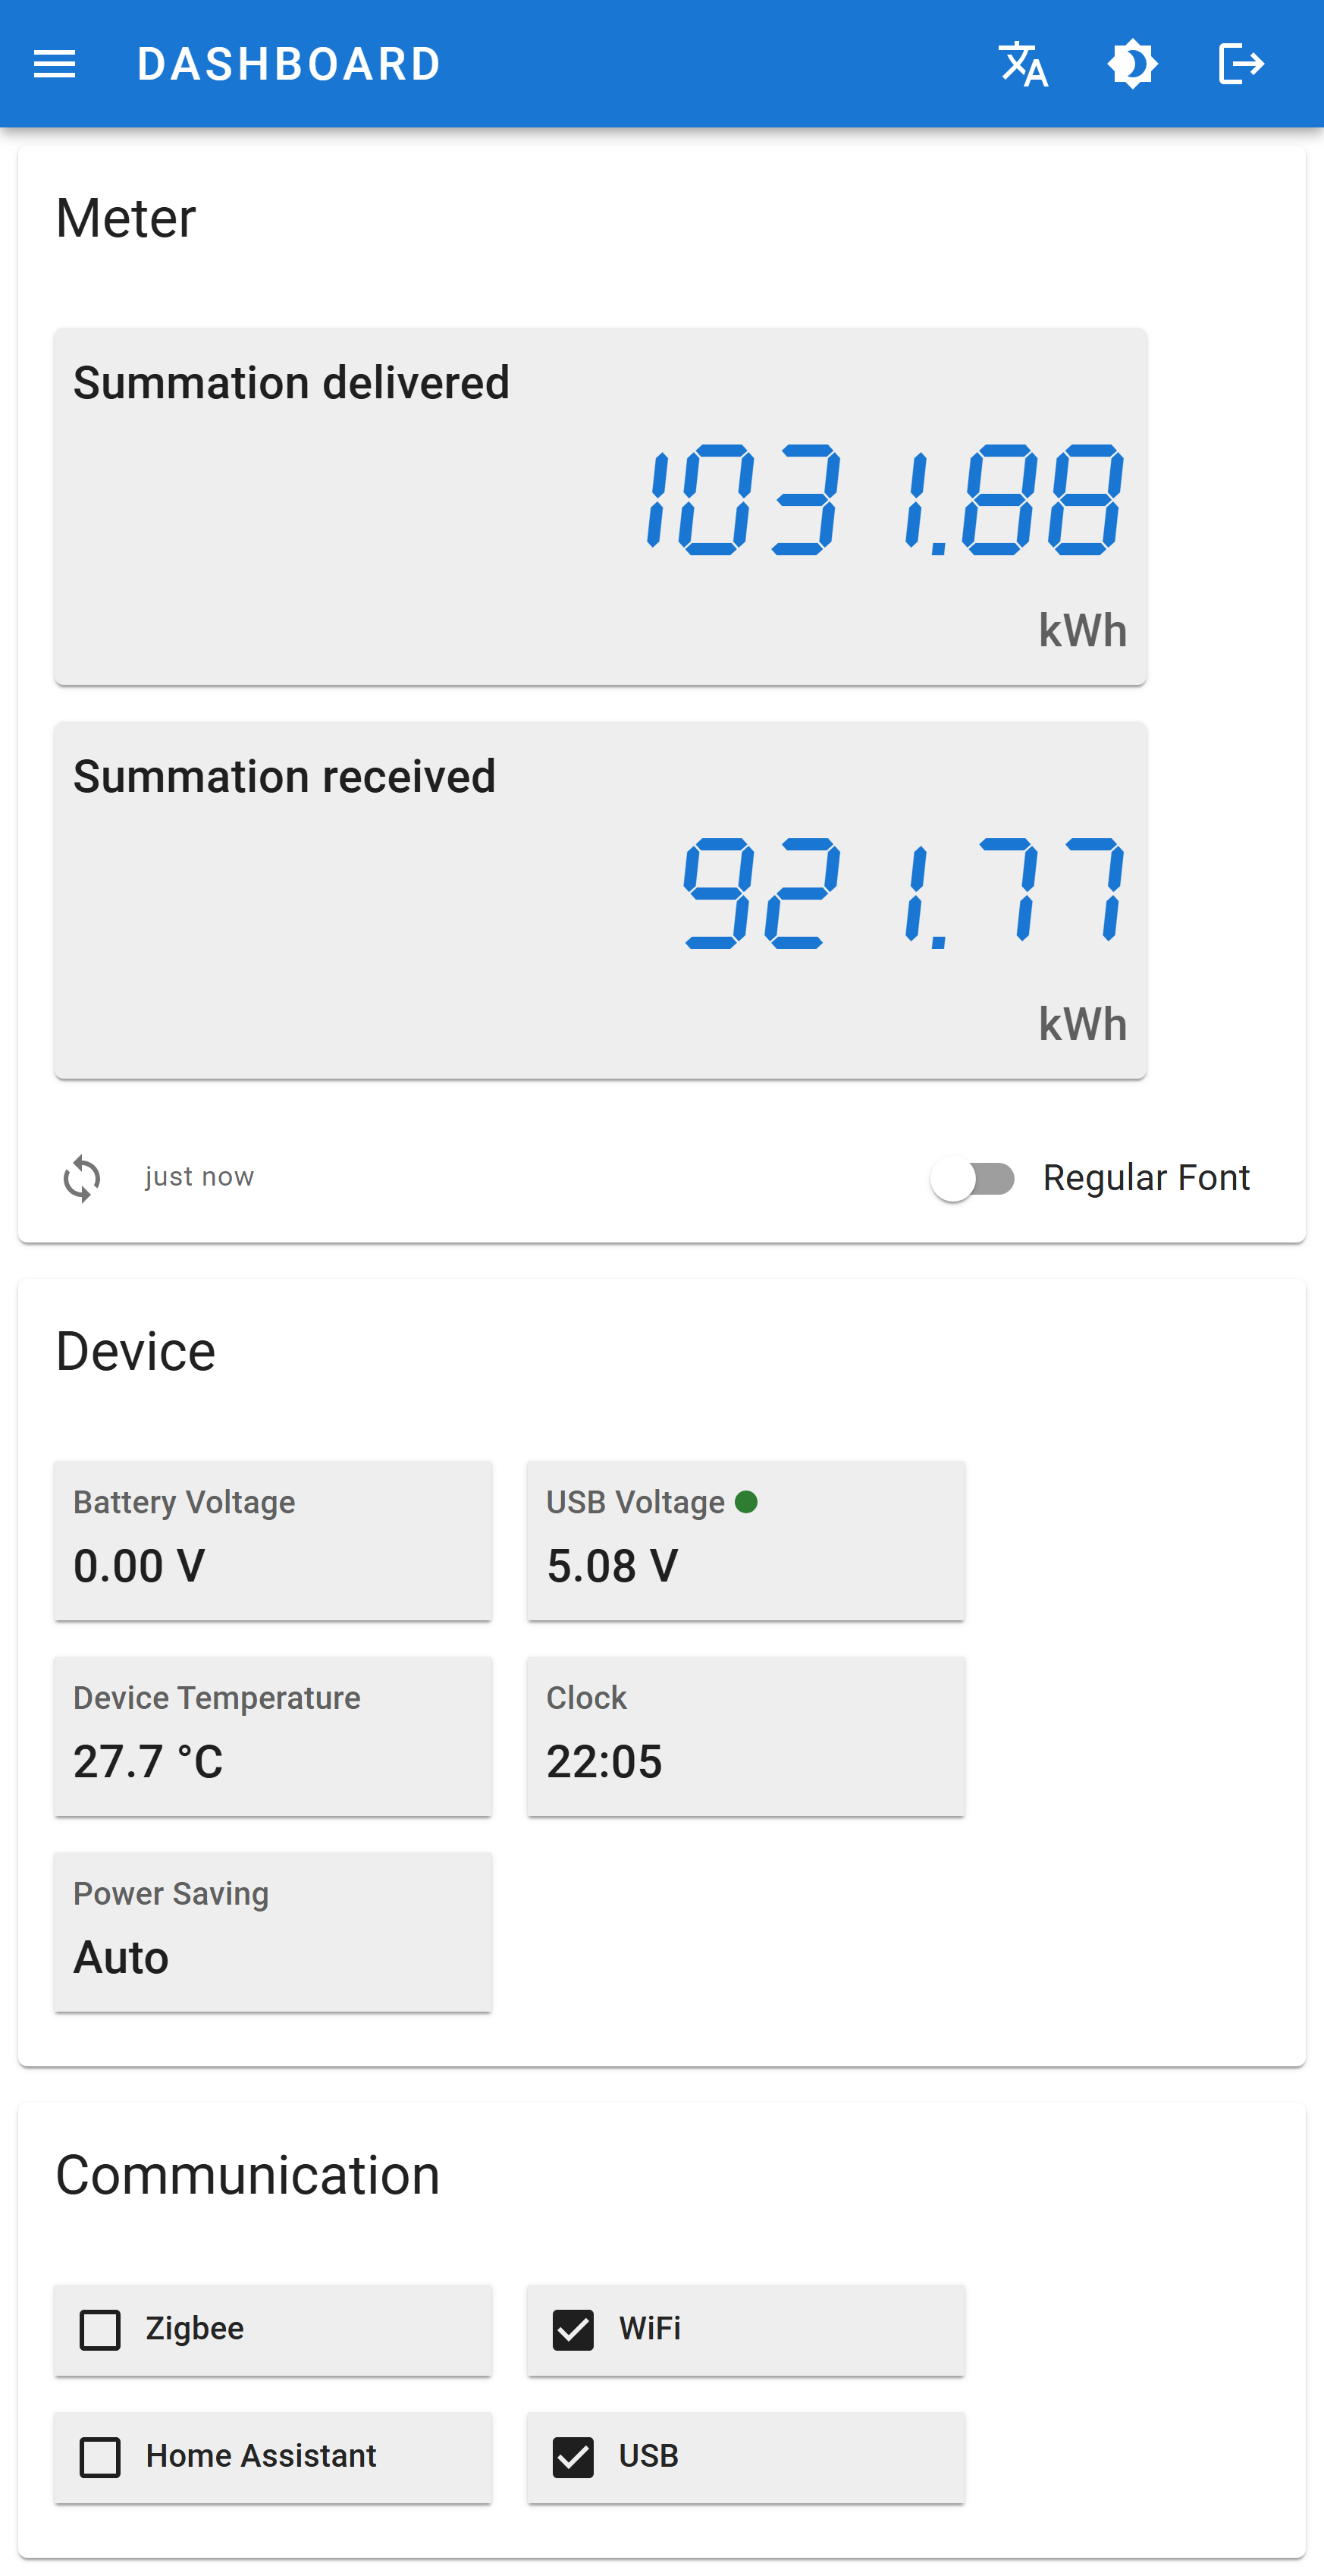
Meter
The cumulative totals from the last readout.
| Value | Meaning |
|---|---|
| Summation delivered | Total energy imported from the grid |
| Summation received | Total energy exported to the grid — only if the meter reports it |
A timestamp under the card shows how long ago the readout happened. Dashes mean no successful readout yet; see Troubleshooting.
Regular Font switches the seven-segment display style to a plain typeface.
Device
Power inputs and health.
| Field | Notes |
|---|---|
| Battery voltage | 0.00 V means no cells fitted or fully discharged. A green dot marks the source currently in use. |
| USB voltage | Around 5 V when a supply is connected. |
| Device temperature | Internal sensor. Useful for checking a hot meter cabinet. |
| Clock | Local time. Shows Not synchronized until the clock has been set — over Zigbee, NTP or manually. |
| Power saving | Auto, Always or Never — see Power and batteries. |
Communication
Which channels are currently enabled: Zigbee, WiFi, Home Assistant and USB. These are enable flags, not link status — for the state of a connection use the WiFi or Zigbee page.
API equivalent
The whole screen comes from GET /api/v1/system/status and GET /api/v1/iec62056/last.