Home Assistant Energy dashboard
Home Assistant has a dedicated Energy dashboard for consumption, production and cost over time. ZiggyMeter's cumulative energy sensors are exactly what it wants: monotonically increasing totals, straight from the meter that bills you.
Configure it
Open Settings → Dashboards → Energy, or go to the Energy dashboard and select Configure.
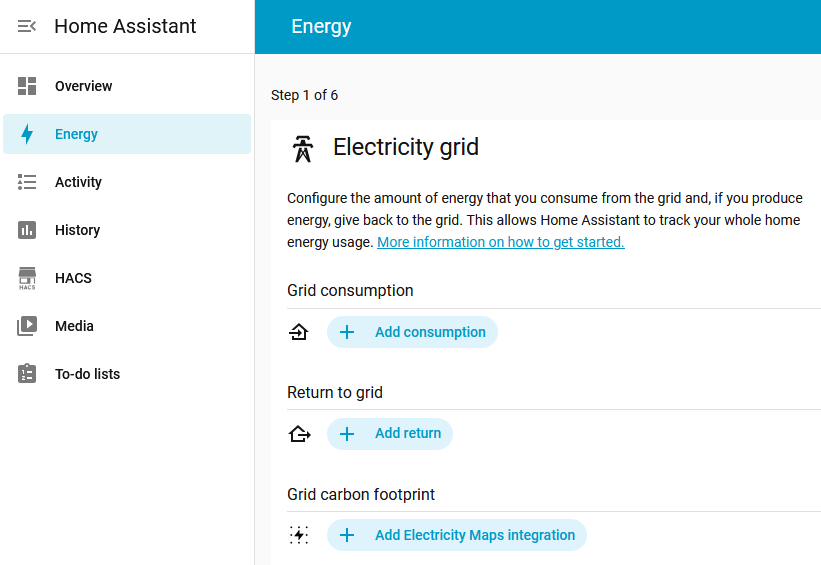
- Under Grid consumption, add the sensor for energy imported from the grid.
- If you export — solar PV, for instance — add the export sensor under Return to grid.
Which sensor to use
| Integration | Grid consumption | Return to grid |
|---|---|---|
| Zigbee | ZiggyMeter Summation delivered | ZiggyMeter Summation received |
| Native (Wi-Fi) | The sensor for OBIS 1-0:1.8.0 | The sensor for OBIS 1-0:2.8.0 |
If your meter uses tariff registers, 1.8.1 and 1.8.2 are day and night sub-totals of 1.8.0. Use the total unless you want to bill the tariffs separately — adding both the total and its parts double-counts.
Give it time
The Energy dashboard aggregates hourly. Nothing appears until at least one full hour has passed with two readings to compare, so:
- On an hourly schedule, expect the first bar after about two hours.
- On a daily schedule, expect a day.
INFO
The dashboard's resolution can never be better than your reading schedule. A device reading once a day produces one data point a day, however the dashboard is configured.
Costs
Home Assistant can attach a tariff to each sensor — a fixed price, or an entity carrying a variable price. Because ZiggyMeter reports the meter's own registers, the totals match what your supplier bills, so the cost figures are directly comparable to your invoice.
See the Home Assistant documentation for details:https://www.home-assistant.io/docs/energy/.